
2D Histogram
Calculates and stores a 2D histogram (matrix) from two 16-bit input values. Ideal for PSD matrices, time-of-flight analysis, and multi-parameter event correlation.
Introduction
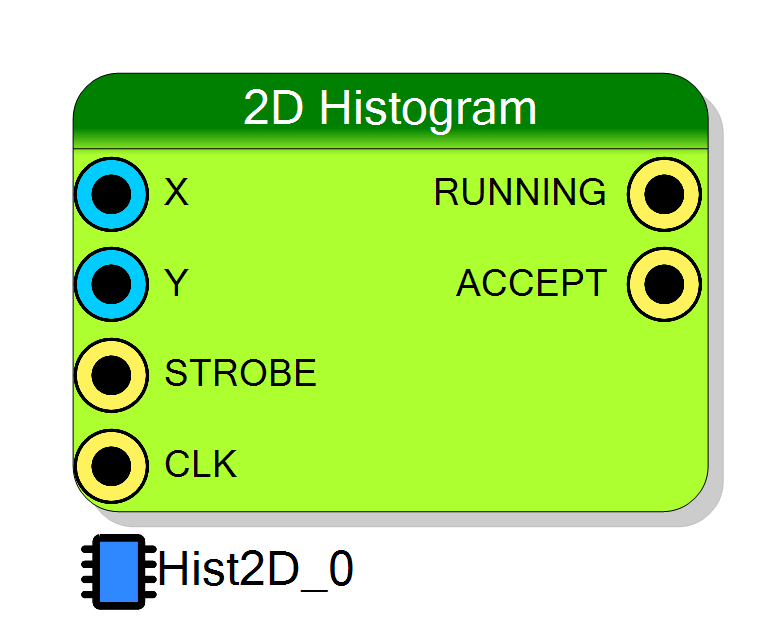
The 2D Histogram block calculates a two-dimensional histogram (matrix) from a pair of 16-bit input values (X, Y). Each time a STROBE pulse arrives, the block increments the bin at position (X, Y) in the internal memory.
The histogram data can be read via Resource Explorer or programmatically using the SciSDK library.
SciSDK Documentation: https://nuclearinstruments.github.io/SCISDK/
Pin Description
16-bit input value for the X-axis (columns). Determines the horizontal position in the histogram matrix.
Typically connected to energy output from a pulse processor.
16-bit input value for the Y-axis (rows). Determines the vertical position in the histogram matrix.
Typically connected to PSD, time-of-flight, or other correlated parameter.
Data valid strobe signal. When HIGH, the X and Y values are sampled and the corresponding bin is incremented.
Connect to the data valid signal from your processing chain.
Properties
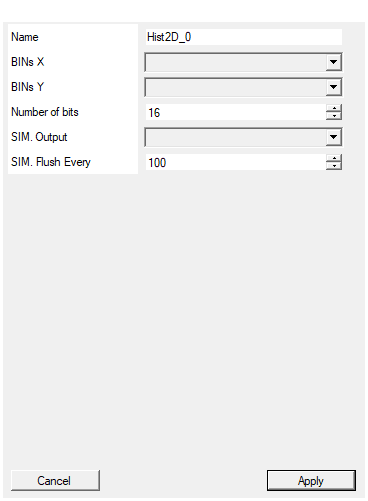
Set the name of the endpoint
Default: Hist2D_0
Number of bins on X axe
Default: 64
Options: 4 8 16 32 64 128 256 512 1024 2048
Number of bins on Y axe
Default: 64
Options: 4 8 16 32 64 128 256 512
Number of bits for each bin
Default: 16
Range: 8 – 32
What the block does with its input WHEN THE PROJECT IS SIMULATED (it has no effect on the synthesized design). None: the block does nothing, as it has always done. Event list: every strobed pair is written to a text file, one ‘<time_ns>
Default: None
Options: None Event list Histogram
How many accepted events the simulation output waits before writing to disk. VHDL has no end-of-simulation hook, so the file cannot simply be written once at the end. In ‘Histogram’ mode a flush rewrites all BINs X * BINs Y rows, so flushing after every event is very slow - at 2048 x 512 that is a million lines per event. The default of 100 trades the last partial batch for speed; lower it to 1 to never lose anything. The file is flushed anyway as soon as the event stream goes quiet, so a run with fewer events than this still produces complete data.
Default: 100
Bit depth per bin (8-32 bits). Determines the maximum count per bin: max_count = 2^bits - 1.
| Bits | Max Count |
|---|---|
| 8 | 255 |
| 16 | 65,535 |
| 24 | 16,777,215 |
| 32 | 4,294,967,295 |
Default: 16
What the block writes to disk when the project is simulated. It has no effect on the synthesized design.
| Value | File content |
|---|---|
| None | Nothing is written (default). |
| Event list | One <time_ns> <x> <y> line per strobed pair, with the raw input values. |
| Histogram | The whole array as <x> <y> <counts>, one row per bin, X running fastest. |
The histogram rows come out in memory order — the same order the hardware address
y*BinsX + x walks — so the file is the flat array laid out in sequence:
# format : <x> <y> <counts>
0 0 2
1 0 0
2 0 1
3 0 0
0 1 0
...
The file is written to the project’s sim_results folder as <page>_<endpoint>.txt
(<endpoint>.txt on the top page). The path is printed in the compiler log.
Binning is the hardware’s: x = min(X, BINs X - 1) and y = min(Y, BINs Y - 1) —
the index saturates on the last bin, it does not wrap the way the 1D Spectrum
does. Bin counters wrap at 2^bits like the BRAM ones.
Default: None
How many accepted events the simulation output waits before writing to disk. VHDL has no end-of-simulation hook, so the file cannot simply be written once at the end of the run.
In Histogram mode a flush rewrites all BINs X × BINs Y rows — at 2048 × 512
that is a million lines — so flushing after every event is very slow. The default of
100 trades the last partial batch for speed; set it to 1 to never lose anything.
The file is flushed anyway as soon as the event stream goes quiet, so a run with fewer events than this still produces complete data.
Default: 100
Usage
How It Works
The 2D Histogram accumulates events in a matrix structure:
- X value determines the column (horizontal position)
- Y value determines the row (vertical position)
- STROBE validates the data and increments the corresponding bin
┌──────────────────────────────────────────────────────────────────┐
│ 2D Histogram Operation │
│ │
│ X (16-bit) ───►┌──────────────┐ │
│ │ │ ┌─────────────────────┐ │
│ Y (16-bit) ───►│ 2D Histogram│────►│ Internal Memory │ │
│ │ │ │ (BRAM Matrix) │ │
│ STROBE ───────►│ │ └─────────────────────┘ │
│ └──────────────┘ │ │
│ ▼ │
│ Resource Explorer / SciSDK │
└──────────────────────────────────────────────────────────────────┘
Typical Applications
- PSD Matrix: Energy on X-axis, Pulse Shape Discrimination (PSD) value on Y-axis
- Time-of-Flight: Energy vs time correlation
- Rise Time Analysis: Pulse characteristics correlation
- Multi-parameter coincidence: Any two correlated parameters
Memory Organization
The 2D matrix is stored in linear memory in row-major order:
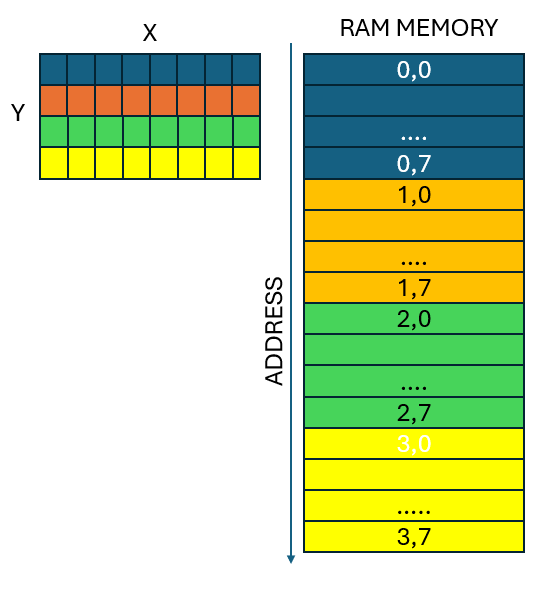
Address calculation: address = Y * BinsX + X
For example, with BinsX = 8:
- (0,0) → address 0
- (7,0) → address 7
- (0,1) → address 8
- (7,1) → address 15
Memory Usage
The BRAM memory consumption is:
Memory = BinsX × BinsY × (Bits / 16) BRAM blocks
| Configuration | Memory (16-bit) | Memory (32-bit) |
|---|---|---|
| 64 × 64 | 4K words | 8K words |
| 128 × 128 | 16K words | 32K words |
| 256 × 256 | 64K words | 128K words |
| 512 × 512 | 256K words | 512K words |
Software Integration with SciSDK
The 2D Histogram is fully supported by SciSDK. For complete documentation see: SciSDK 2D Histogram Guide
Available Parameters
| Parameter | Access | Description |
|---|---|---|
limitmode |
R/W | Integration mode: freerun, time_ms, total_count, peak_count |
limit |
R/W | Target threshold value (32-bit) |
binsX |
R | Number of bins on X axis |
binsY |
R | Number of bins on Y axis |
Available Commands
| Command | Description |
|---|---|
start |
Begin histogram integration |
stop |
Pause integration |
reset |
Clear all bins to zero |
reset_counters |
Reset limit and statistics counters |
C/C++ Example
c
#include "SciSDK_DLL.h"
// Allocate buffer
SCISDK_2DHISTOGRAM_DECODED_BUFFER *hist2d;
SCISDK_AllocateBuffer("board0:/MMCComponents/Hist2D_0",
T_BUFFER_TYPE_DECODED,
(void**)&hist2d, _sdk);
// Configure and start
SCISDK_SetParameterString("board0:/MMCComponents/Hist2D_0.limitmode",
"freerun", _sdk);
SCISDK_ExecuteCommand("board0:/MMCComponents/Hist2D_0.reset", "", _sdk);
SCISDK_ExecuteCommand("board0:/MMCComponents/Hist2D_0.start", "", _sdk);
// Read data
SCISDK_ReadData("board0:/MMCComponents/Hist2D_0", (void*)hist2d, _sdk);
// Access data: hist2d->data[y * binsX + x]
for (int y = 0; y < hist2d->info.binsY; y++) {
for (int x = 0; x < hist2d->info.binsX; x++) {
uint32_t count = hist2d->data[y * hist2d->info.binsX + x];
// Process count...
}
}
// Free buffer
SCISDK_FreeBuffer("board0:/MMCComponents/Hist2D_0",
T_BUFFER_TYPE_DECODED,
(void**)&hist2d, _sdk);
Python Example
python
from scisdk.scisdk import SciSDK
sdk = SciSDK()
sdk.AddNewDevice("usb:10500", "dt5560", "board0", "RegisterFile.json")
# Allocate and configure
res, buf = sdk.AllocateBuffer("board0:/MMCComponents/Hist2D_0",
sdk.T_BUFFER_TYPE_DECODED)
sdk.SetParameter("board0:/MMCComponents/Hist2D_0.limitmode", "freerun")
sdk.ExecuteCommand("board0:/MMCComponents/Hist2D_0.reset", "")
sdk.ExecuteCommand("board0:/MMCComponents/Hist2D_0.start", "")
# Read and display
res, buf = sdk.ReadData("board0:/MMCComponents/Hist2D_0", buf)
import matplotlib.pyplot as plt
import numpy as np
data_2d = np.reshape(buf.data, (buf.info.binsY, buf.info.binsX))
plt.imshow(data_2d, aspect='auto', origin='lower')
plt.colorbar()
plt.show()
Simulation Output
In the synthesized design the array is read back over the register bus by software.
During a project simulation nothing reads it, so a simulated 2D Histogram showed
nothing at all. With SIM. Output set, the block dumps either the raw event stream or
the binned array into the project’s sim_results folder, next to the waveform dump.
The histogram is written as a plain three-column table, one row per bin, which drops
straight into gnuplot (splot), numpy loadtxt or a spreadsheet.
Two notes:
- The bin index saturates on the last bin —
min(X, BINs X - 1)— which is what the hardware does (qXis forced to all ones when any bit above the axis width is set). Note this differs from the 1D Spectrum, whose index wraps. - Like the Spectrum’s model, this one counts one event per strobed clock. The real block needs 3 clocks per event and drops strobes that arrive while it is busy, so back-to-back strobes give a higher count in simulation than on hardware.
When the data reaches disk
The file is flushed every SIM. Flush Every accepted events (100 by default), and also as soon as the event stream goes quiet (256 write clocks with no event). The quiet-stream flush is what makes a short run — fewer events than the flush period — still come out complete; you only lose events that are still arriving when the simulation stops.
Resources & Timing
-
Latency: 2-3 clock cycles for bin update
-
Throughput: One event per clock cycle
- Uses BRAM for histogram storage
- Memory usage: BinsX × BinsY × ceil(bits/16) BRAM words
- Fully supported by Resource Explorer and SciSDK
- Row-major memory layout for efficient sequential access