Oscilloscope
Guide to using the Oscilloscope tool in Resource Explorer for visualizing analog and digital input signals from Oscilloscope blocks in your SCI-Compiler project.
Overview
The Oscilloscope tool in Resource Explorer allows visualization of analog and digital input signals from Oscilloscope blocks that have been added to the project diagram.
Each Oscilloscope block added to the design appears in the Oscilloscope list in Resource Explorer and can be opened to display its input signals in real-time.
Opening the Oscilloscope Window
To open the oscilloscope interface:
- In Resource Explorer, expand the Oscilloscopes tree
- Select the desired Oscilloscope component
- Press the View button
The oscilloscope window opens showing the component name and its hexadecimal address in the title bar.
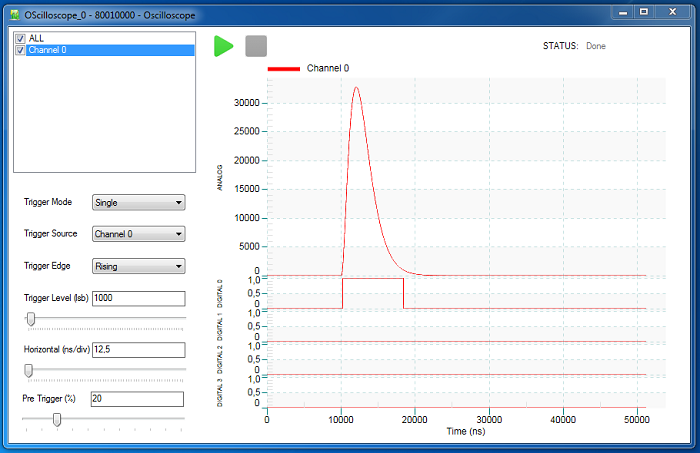
Oscilloscope Interface
Channel Selection
The left panel shows the list of available channels corresponding to the inputs of the Oscilloscope block in the design.
Selecting Channels:
- Check individual channels to display them in the plot
- Each channel shows all connected signals (both analog and digital)
- All signals from the same channel are displayed in the same color
- Only channels with connected inputs appear in the list
All Channels Option:
- Flag the “All channels” checkbox to display all input signals simultaneously
- Useful for viewing multiple channels at once
Trigger Configuration
Trigger Mode
Two trigger modes are available:
Auto:
- Continuously refreshes the plot
- Displays the last acquired waveform even when no trigger occurs
- Use for continuous monitoring
Single:
- Updates the image only once when trigger condition is met
- Stops after capturing one waveform
- Use for capturing specific events
Trigger Source
Select the trigger source from the Trigger Source dropdown:
Free Running:
- Acquires waveforms periodically without waiting for a trigger
- No trigger condition required
- Useful for viewing continuous signals
External:
- Uses the trigger signal provided to the Oscilloscope block
- The trigger input must be connected in the design diagram
- Trigger occurs when the external signal meets the condition
Channel x:
- Uses the analog signal from one of the input channels as trigger
- Select which channel (Channel 0, Channel 1, etc.)
- The oscilloscope triggers based on the selected channel’s signal
Trigger Edge
When using a channel as trigger source, select the trigger edge:
Rising:
- Triggers on the rising edge of the signal
- Signal crosses the trigger level going upward
Falling:
- Triggers on the falling edge of the signal
- Signal crosses the trigger level going downward
Trigger Level
Set the threshold for the trigger condition:
Trigger Level (lsb) field:
- Enter the trigger threshold value in LSB (Least Significant Bits)
- The value corresponds to the ADC digital value
- Can also be adjusted using the trackbar slider
Time Base and Position
Horizontal Scale
Horizontal (ns/div) field:
- Sets the time scale in nanoseconds per division
- Adjust the value to zoom in/out on the time axis
- Can also be adjusted using the trackbar slider
- Smaller values show more detail (shorter time window)
- Larger values show longer time periods
Pre-Trigger Position
Pre Trigger (%) field:
- Sets the percentage of the waveform displayed before the trigger point
- Range: 0% to 100%
- 0% shows only post-trigger data
- 50% shows equal amounts of pre and post-trigger data
- 100% shows only pre-trigger data
- Can also be adjusted using the trackbar slider
Acquisition Control
Start Button

- Click to start signal acquisition
- The oscilloscope begins capturing waveforms according to the trigger settings
Stop Button

- Click to stop data acquisition
- Available when Trigger Mode is set to “Auto”
- Freezes the current display
Status Indicator
The STATUS label shows the current oscilloscope state:
Idle:
- Oscilloscope is not acquiring
- Waiting for start command
Waiting for trigger:
- Acquisition is armed
- Waiting for trigger condition to be met
Acquisition done:
- Waveform has been captured
- Data is displayed in the plot
Zoom and Navigation
Keyboard Shortcuts
Use these keys to zoom the waveform display:
v key:
- Enables zoom in the Y direction (vertical)
- After pressing, use the left mouse button to select the vertical range to zoom
h key:
- Enables zoom in the X direction (horizontal)
- After pressing, use the left mouse button to select the horizontal range to zoom
z key:
- Enables zoom in both X and Y directions
- After pressing, use the left mouse button to select the rectangular area to zoom
u key:
- Zooms out the plot
- Returns to the previous zoom level
Zoom Procedure
- Press the desired zoom key (v, h, or z)
- Click and drag with the left mouse button to select the area to zoom
- Release the mouse button to apply the zoom
- Press u to zoom out
Plot Features
Cursor Information
The top right corner of the plot displays the coordinates of the data point under the mouse cursor.
This shows:
- X coordinate: Time position in nanoseconds
- Y coordinate: Signal value in LSB
Move the mouse over the plot to view values at different points.
Multi-Channel Display
When multiple channels are selected:
- Each channel is displayed in a different color
- All signals from the same channel share the same color
- Both analog and digital signals from a channel are shown together
- The legend identifies which color corresponds to which channel
Usage Examples
Example 1: Viewing a Single Channel
- Select one channel from the list
- Set Trigger Source to that channel
- Set Trigger Edge to “Rising”
- Set an appropriate Trigger Level
- Click
- The waveform appears when the trigger condition is met
Example 2: Continuous Monitoring
- Select the channels to monitor
- Set Trigger Mode to “Auto”
- Set Trigger Source to “Free Running”
- Click
- Waveforms continuously update
- Click
to freeze the display
Example 3: Single Shot Capture
- Select the channels to capture
- Set Trigger Mode to “Single”
- Configure trigger source and level for the event to capture
- Click
- Status shows “Waiting for trigger”
- When the event occurs, the waveform is captured once
- Status shows “Acquisition done”
Example 4: Examining Signal Details
- Capture a waveform using any method above
- Press z key to enable area zoom
- Click and drag to select the region of interest
- The plot zooms to show details
- Move mouse over points to read exact values
- Press u to zoom out
Related Documentation
- Resource Explorer - Main Resource Explorer overview
- Register Control - Register operations
- Logic Analyzer - Digital signal capture