
Rate Meter (Multi-Channel)
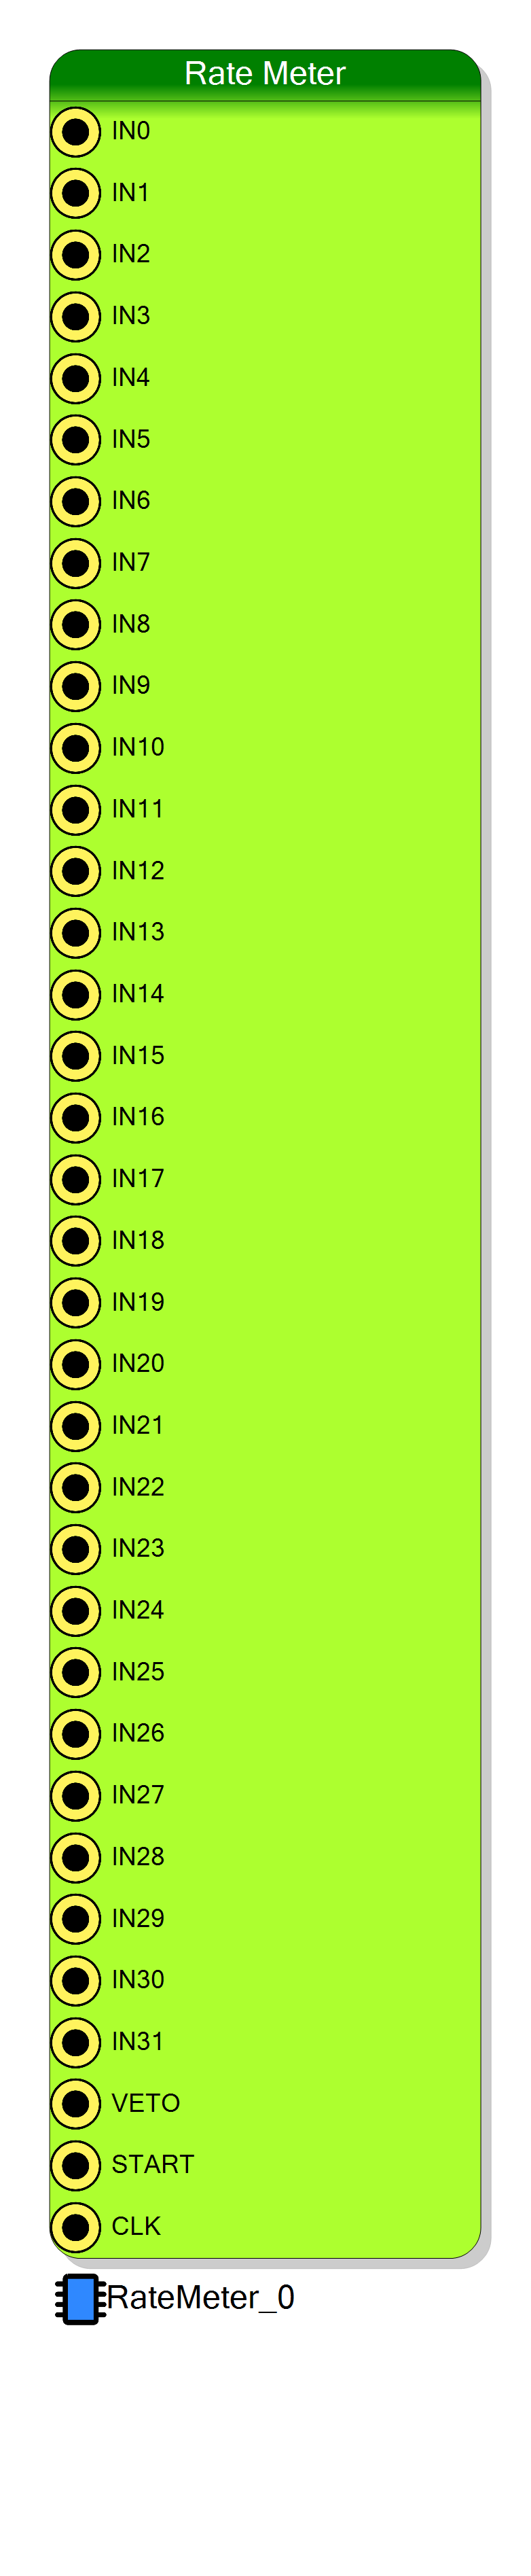
MCRateMeter is a multi-channel rate meter that measures the frequency (rate) of digital input signals. It supports up to 256 independent channels, providing both instantaneous rate measurements and cumulative event counts. Ideal for monitoring detector count rates, trigger rates, and system diagnostics.
Introduction
Principle of Operation
The Rate Meter block measures the event rate (frequency) of multiple digital input signals simultaneously.
For each input channel, the block counts rising edges during a configurable integration period:
$$ Rate_i = \frac{N_{counts,i}}{T_{integration}} $$
where:
- $N_{counts,i}$ = number of rising edges detected on channel $i$
- $T_{integration}$ = integration time (determined by clock frequency setting)
The block provides two types of measurements:
- Rate: Events per integration period (updated periodically)
- Counts: Total accumulated events since START (continuously updated)
Pin Description
Properties
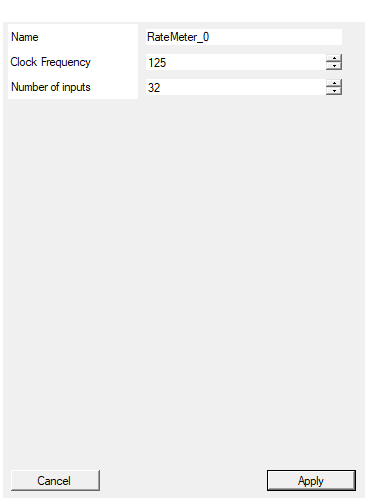
Set the name of the endpoint
Logical endpoint name used in the register map. Used by Resource Explorer and SciSDK.Default: RateMeter_0
Frequency of the input clock
Expected clock frequency in MHz. Used to calculate the integration period.
If set equal to the actual clock frequency, integration time = 1 second. Set to a lower value for faster rate updates (with proportional scaling).
Example: With 125 MHz clock and 12.5 MHz setting, integration time = 0.1 s, multiply rate by 10 to get Hz.
Default: 125
Number of channels
Number of input channels to monitor. Range: 1 to 256. Each channel has independent rate and count registers.Default: 32
Detailed Operation
Data Flow
┌────────────────────────────────────────────────────────────────────┐
│ Rate Meter Data Flow │
│ │
│ IN0 ───►┌──────────────┐ ┌─────────────┐ │
│ IN1 ───►│ Counter │────►│ Memory │───► Rate[N] │
│ ... │ Array │ │ (N×32-bit) │ │
│ IN_N───►│ (N ch) │ │ │───► Counts[N] │
│ └──────────────┘ └─────────────┘ │
│ │ │
│ VETO ────────►│ (inhibit counting when HIGH) │
│ START ───────►│ (reset counters on rising edge) │
│ CLK ─────────►│ (timing reference) │
└────────────────────────────────────────────────────────────────────┘
Integration Time Configuration
The integration time is determined by the Clock Frequency property and the actual input clock frequency:
$$ T_{integration} = \frac{f_{CLK_{actual}}}{f_{CLK_{property}}} $$
| Actual CLK | Property Setting | Integration Time | Rate Update |
|---|---|---|---|
| 125 MHz | 125 MHz | 1 second | Every 1 s |
| 125 MHz | 12.5 MHz | 0.1 second | Every 100 ms |
| 125 MHz | 1.25 MHz | 0.01 second | Every 10 ms |
Note: When using a shorter integration time, multiply the measured rate by the inverse factor to get events/second.
Timing Diagram
Memory Map
The rate meter data is mapped at two address ranges:
| Address Range | Content | Description |
|---|---|---|
| Base + 0 to Base + N-1 | Rate[0..N-1] | Rate values (events/period) |
| Base + 512 to Base + 512 + N-1 | Counts[0..N-1] | Cumulative counts |
Each value is a 32-bit unsigned integer.
Use Cases
- Detector monitoring: Track count rates from multiple detector channels
- Trigger rate measurement: Monitor trigger logic output rates
- Dead time estimation: Compare input vs. accepted event rates
- System diagnostics: Monitor signal integrity and noise levels
- Beam monitoring: Track particle beam intensity variations
Software Integration
The Rate Meter is memory-mapped and can be read via SciSDK.
Available SDK Functions
| Function | Description |
|---|---|
RATE_METER_<name>_GET_DATA |
Read rate values for all channels |
RATE_METER_<name>_GET_DATA_COUNTS |
Read cumulative counts for all channels |
Python Example
python
from scisdk.scisdk import SciSDK
import matplotlib.pyplot as plt
sdk = SciSDK()
sdk.AddNewDevice("usb:10500", "dt5560", "board0", "RegisterFile.json")
# Read rate data for 32 channels
res, rate_data = sdk.ReadData("board0:/MMCComponents/RateMeter_0",
channels=32, timeout=1000)
# Read cumulative counts
res, count_data = sdk.ReadData("board0:/MMCComponents/RateMeter_0.counts",
channels=32, timeout=1000)
# Plot channel rates
plt.figure(figsize=(12, 6))
plt.bar(range(32), rate_data)
plt.xlabel("Channel")
plt.ylabel("Rate (events/period)")
plt.title("Multi-Channel Rate Monitor")
plt.show()
# Print total counts
for ch, count in enumerate(count_data):
if count > 0:
print(f"Channel {ch}: {count} events")
C Example
c
#include "SciSDK_DLL.h"
uint32_t rates[256];
uint32_t counts[256];
uint32_t read_data, valid_data;
// Read rates for 32 channels
RATE_METER_RateMeter_0_GET_DATA(rates, 32, 1000, &handle,
&read_data, &valid_data);
// Read counts for 32 channels
RATE_METER_RateMeter_0_GET_DATA_COUNTS(counts, 32, 1000, &handle,
&read_data, &valid_data);
// Print results
for (int i = 0; i < 32; i++) {
printf("CH%02d: Rate=%8u Counts=%10u\n", i, rates[i], counts[i]);
}
Resources & Timing
- Throughput: One count per clock per channel (no pile-up at clock rate)
- Uses dual-port memory for rate and count storage
- Rate values are snapshots at integration period boundaries
- Count values are continuously updated
- VETO inhibits all channels simultaneously
- START resets all channels simultaneously