Logic Analyzer
Guide to using the Logic Analyzer tool in Resource Explorer for visualizing and analyzing multiple digital signals in the time domain from Logic Analyzer blocks in your SCI-Compiler project.
Overview
The Resource Explorer offers the possibility to visualize and analyze multiple digital signals simultaneously in the time domain using the Graphic Display of the Logic Analyzer.
Logic Analyzer blocks added to the project diagram appear in the Logic Analyzer list in Resource Explorer and can be displayed in a timing diagram view.
Opening the Logic Analyzer Window
To open the logic analyzer graphic display:
- In Resource Explorer, expand the Logic Analyzer tree
- Right-click on the desired Logic Analyzer component
- Select Add to Graphic Display from the menu
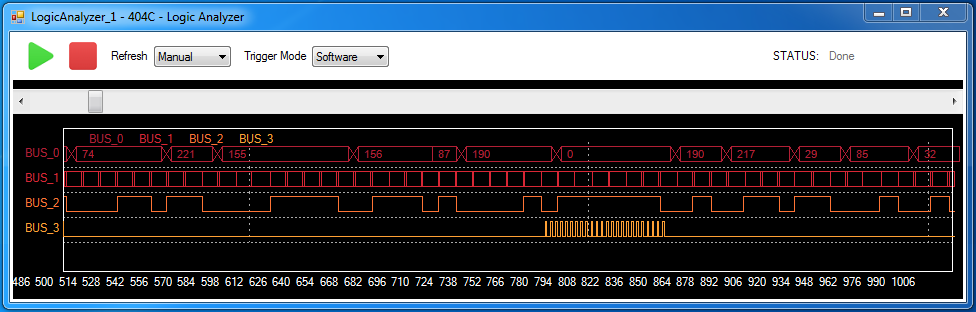
The logic analyzer window opens showing the component name and its hexadecimal address in the title bar.
Signal Display
Signal Layout
All input signals of the selected Logic Analyzer are displayed in different rows, with each row labeled with the signal name defined by the user in the design.
1-Bit Digital Signals
For single-bit digital signals (e.g., BUS_2, BUS_3 in the example):
- High value: Represents logic one (1)
- Low value: Represents logic zero (0)
- The waveform shows transitions between high and low states
Multi-Bit Digital Signals
For digital signals with multiple bits (e.g., BUS_0, BUS_1 in the example):
- Different states are represented with blocks of different lengths
- Each block length indicates the time duration of that state
- Number in block: The value of the signal during that time period (e.g., BUS_0)
- “x” symbol: Denotes a transition in the digital signal value
- If the duration of a state is too short, the number will not be displayed (e.g., BUS_1)
To visualize faster transitions more clearly, zoom the graph using the mouse wheel.
Acquisition Controls
Start/Stop Buttons

- Click to start the input signal acquisition
- The logic analyzer begins capturing digital signals

- Click to stop the input signal acquisition
- Freezes the current display
Refresh Mode
The refresh menu provides options for updating the display:
Manual refresh:
- Display updates only when requested
- User controls when to refresh the waveform
Automatic refresh:
- Display continuously updates
- Shows real-time signal changes
Trigger Mode
The Trigger Mode menu selects the trigger source:
Signal:
- Uses the trigger provided by the trigger input of the Logic Analyzer block
- The trigger input must be connected in the design diagram
- Acquisition starts when the external trigger condition occurs
Software:
- Uses internal software trigger
- Acquisition starts immediately when the Start button is pressed
- No external trigger required
Navigation and Time Display
Time Navigation
Upper bar:
- Slider to move through the time acquisition
- Drag the slider to view different portions of the captured data
Bottom display:
- Shows the corresponding time value on the X-axis
- Indicates the current position in the time domain
Zoom
Use the mouse wheel to zoom in and out:
- Scroll up to zoom in (see more detail, shorter time span)
- Scroll down to zoom out (see longer time span, less detail)
Status Indicator
The STATUS label shows the current logic analyzer state:
Idle:
- Logic analyzer is not acquiring
- Waiting for start command
Waiting for trigger:
- Acquisition is armed
- Waiting for trigger condition to be met
Acquisition done:
- Signal capture is complete
- Waveforms are displayed in the graph
Related Documentation
- Resource Explorer - Main Resource Explorer overview
- Register Control - Register operations
- Oscilloscope - Analog signal visualization
- List Module - Data download operations