Resource Explorer
Guide to using the Resource Explorer tool for testing and debugging FPGA firmware. Connect to hardware, inspect registers, visualize signals with oscilloscopes and logic analyzers, and interact with firmware components in real-time.
Overview
The Resource Explorer is a powerful debugging and testing tool integrated into SCI-Compiler that enables real-time interaction with FPGA firmware running on connected hardware. It provides a graphical interface to access all memory-mapped components, including:
- Registers - Read and write configuration and status registers
- List Modules - Access FIFO and data buffer components
- Logic Analyzers - Capture and visualize digital signals
- Oscilloscopes - Monitor and analyze analog and digital waveforms
The Resource Explorer uses the SciSDK library to communicate with the hardware through USB, Ethernet, or VME connections, reading the RegisterFile JSON descriptor to understand the firmware structure.
Launching Resource Explorer
To open the Resource Explorer:
- Click the Resource Explorer button in the Compiler group of the Home toolbar
- The Connection window will appear
Prerequisites:
- Hardware must be powered on and connected to the PC
- Firmware must be compiled and programmed to the FPGA
- RegisterFile JSON file must be available in the project’s
libraryfolder
Connection Configuration
When launching Resource Explorer, the Connection window allows you to configure hardware access:
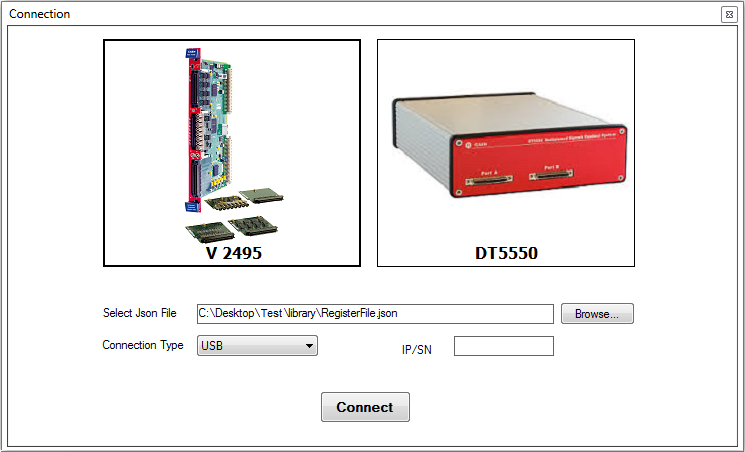
Connection Parameters
Board Model Selection
Click on one of the board icons to select your target hardware:
- DT1260 - Desktop digitizer with 8 analog channels
- R5560 - Rack-mount digitizer
- R5560SE - Special edition variant
- DT5560 - Desktop variant
- DT5550 - 4-channel desktop digitizer
- DT5560PET - PET-specific configuration
- V2495 - VME board with Intel FPGA
- X274X - CAEN VME board family
Connection Type
Select the communication interface from the Connection Type dropdown:
USB Connection:
- Most common connection method
- Automatically detects connected boards
- Serial Number dropdown fills automatically with detected devices
- Select your board from the Serial Number list
- Supports up to 127 devices on the USB bus
Ethernet Connection:
- Used for remote access or when USB is unavailable
- Enter the board’s IP address in the IP field
- Default IP addresses are typically in the format
192.168.xxx.xxx - Ensure the board and PC are on the same network segment
- Check firewall settings if connection fails
VME Connection (V2495 and X274X boards):
- Requires VME crate and VME-USB bridge (e.g., V1718, V2718)
- Select VME bridge device from the dropdown
- Specify VME base address of the target board
- Multiple boards can be accessed in the same crate
JSON File Selection
The Selected Json File field specifies the firmware descriptor:
- Click the Browse… button
- Navigate to your project’s
libraryfolder - Select the
RegisterFile.jsonfile - This file is automatically generated during firmware compilation
The JSON file must match the firmware currently running on the FPGA, otherwise:
- Register addresses may be incorrect
- Components may not be accessible
- Read/write operations may fail or corrupt data
Connecting to Hardware
Once all parameters are configured:
- Click the Connect button
- SciSDK will establish communication with the board
- The RegisterFile JSON is parsed
- Resource Explorer main window opens
Connection Error Troubleshooting:
- Board not found: Check USB cable, power, and drivers
- JSON mismatch: Verify the JSON corresponds to the loaded firmware
- Communication timeout: Check connection type settings and network configuration
- Permission denied: Ensure user has access rights to USB/network devices
Resource Explorer Main Window
After successful connection, the main Resource Explorer window displays all available firmware components in a tree structure:
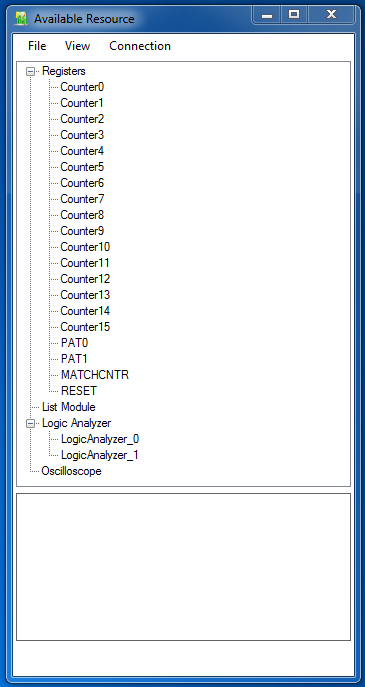
Component Tree Structure
The left panel shows a hierarchical view of all firmware resources:
├── Registers
│ ├── Register_Name_1
│ ├── Register_Name_2
│ └── ...
├── List Modules
│ ├── List_Name_1
│ ├── List_Name_2
│ └── ...
├── Logic Analyzers
│ ├── LogicAnalyzer_1
│ ├── LogicAnalyzer_2
│ └── ...
└── Oscilloscopes
├── Oscilloscope_1
├── Oscilloscope_2
└── ...
Click the "+" symbol next to any component to expand and view its properties, sub-registers, or channels.
Interacting with Components
Double-click any component in the tree to open its dedicated control panel:
- Registers: Opens read/write interface with bit-field visualization
- List Modules: Opens data acquisition and buffer control
- Logic Analyzers: Opens waveform capture and trigger configuration
- Oscilloscopes: Opens real-time signal visualization
Each component type has specialized controls described in their respective documentation sections.
Menu Bar
File Menu
The File menu provides project and session management:
Open
- Load a different RegisterFile JSON
- Allows switching between firmware configurations without reconnecting
- Important: The new JSON must be compatible with the currently loaded firmware
- If mismatch detected, an error dialog will appear:
- “RegisterFile does not match FPGA firmware version”
- “Component addresses are inconsistent”
- Use this when you’ve recompiled firmware and need to reload the descriptor
Save
- Save current Resource Explorer session configuration
- Stores:
- Register values that have been modified
- Table and plot window layouts
- Trigger and acquisition settings
- Saved sessions can be reloaded for repeated tests
- Useful for creating test sequences or validation procedures
Exit
- Closes the Resource Explorer tool
- Automatically disconnects from hardware
- Prompts to save session if unsaved changes exist
View Menu
The View menu enables creation of custom visualization windows:
New Table
- Create a custom register table
- Select multiple registers to monitor simultaneously
- Real-time update of register values
- Edit registers directly in the table
- Use for:
- Configuration parameter tuning
- Status monitoring dashboards
- Batch register read/write operations
Creating a Table:
- Select View → New Table
- Name the table (e.g., “AFE Configuration”)
- Drag registers from the tree into the table
- Right-click table for display options (hex, decimal, binary)
- Click refresh icon for manual update or enable auto-refresh
New Plot
- Create real-time register value plots
- Monitor trends and changes over time
- Multiple registers can be plotted on the same graph
- Use for:
- Temperature monitoring
- Rate counters
- Trigger statistics
- Performance metrics
Creating a Plot:
- Select View → New Plot
- Name the plot (e.g., “Event Rate”)
- Drag numeric registers into the plot
- Configure update rate (10ms - 10s)
- Set Y-axis scale and range
- Enable data logging to CSV if needed
For detailed information on using tables and plots, see the Register Control documentation.
Connection Menu
The Connection menu manages hardware connections:
Disconnect
- Closes the active connection to the board
- Firmware continues running on the FPGA
- Resource Explorer remains open but components are inactive
- Use when:
- Switching to a different board
- Reprogramming the FPGA
- Network maintenance required
New Connection
- Opens the Connection window again
- Configure and connect to a different board
- Previous session configuration is preserved
- Useful for:
- Testing multiple boards sequentially
- Comparing firmware versions
- Switching between USB and Ethernet
Multi-Board Workflow:
- Connect to first board, run tests
- Select Connection → Disconnect
- Select Connection → New Connection
- Configure second board parameters
- Click Connect
Troubleshooting
Connection Issues
Symptom: “Cannot connect to board” error
Possible Causes:
- Board not powered on
- USB/Ethernet cable disconnected
- Wrong connection type selected
- Incorrect IP address
- Firewall blocking communication
Solutions:
- Check physical connections and power
- Verify connection type matches hardware configuration
- For Ethernet: ping the board IP address
- Check Device Manager (Windows) for USB device presence
- Try different USB port or cable
- Temporarily disable firewall for testing
JSON Mismatch Errors
Symptom: “RegisterFile does not match firmware” error
Possible Causes:
- Loaded wrong JSON file
- Firmware has been updated but JSON hasn’t
- Project was recompiled but board wasn’t reprogrammed
Solutions:
- Verify JSON file is from the
libraryfolder of the current project - Check JSON file timestamp matches last compilation
- Reprogram FPGA with matching bitstream
- Recompile project to regenerate JSON
Component Not Responding
Symptom: Register reads return all zeros or all ones
Possible Causes:
- Firmware is not running (clock issue)
- Address mapping error
- Communication bus not initialized
- Component is in reset state
Solutions:
- Check firmware compilation log for errors
- Verify board configuration is correct
- Look for clock status registers
- Check reset control registers
- Try reprogramming the FPGA
Slow Response or Timeouts
Symptom: Operations take a long time or timeout
Possible Causes:
- Network latency (Ethernet connection)
- USB bandwidth saturation
- Too many windows open with fast update rates
- Large data transfers in progress
Solutions:
- Close unnecessary tables and plots
- Reduce update rates
- Switch to USB if using Ethernet
- Check for background applications using USB bandwidth
- Increase timeout values in connection settings
Data Export
Export capabilities for offline analysis:
- Register tables: Export to CSV
- Plots: Export data to CSV, screenshots to PNG
- Logic Analyzer: Export waveforms to VCD format
- Oscilloscope: Export waveforms to CSV or binary