Register Control
Complete guide to reading, writing, and monitoring FPGA registers using the Resource Explorer. Learn how to use Set/Get operations, create register tables for batch operations, and visualize register values in real-time plots.
Overview
Registers are memory-mapped locations in the FPGA firmware that provide access to:
- Configuration parameters - Sample rates, trigger levels, gain settings
- Control commands - Start/stop, reset, enable/disable
- Status information - Firmware version, error flags, state machines
- Counters and statistics - Event counts, rates, timestamps
- Debug information - Internal state, diagnostic values
The Resource Explorer provides three methods to interact with registers:
- Set/Get Window - Individual register read/write operations
- Tables - Batch operations on multiple registers simultaneously
- Plots - Real-time visualization of register value trends
All registers visible in Resource Explorer are defined in the Register File in the Hardware Settings during design, and their addresses are stored in the RegisterFile.json generated during firmware compilation.
Register Addressing
Each register in the Resource Explorer displays:
- Name: User-defined identifier (e.g., “ADC_Gain”, “Trigger_Threshold”)
- Address: Hexadecimal memory address (e.g., 0x1000, 0x1004)
- Access Type: Read-only, write-only, or read-write (indicated in documentation)
The address is automatically assigned during firmware compilation based on the memory map configuration. Multiple registers may be grouped under endpoint addresses.
Set/Get Window
The Set/Get window provides direct access to individual registers for read and write operations.
Opening Set/Get Window
To open the Set/Get window for a register:
- Expand the Registers tree in Resource Explorer
- Right-click on the desired register
- Select Set/Get from the context menu
The window title displays the register name and its hexadecimal address.
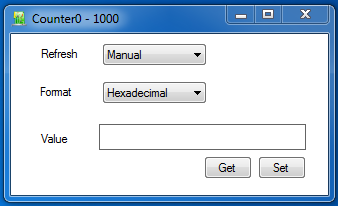
Reading Register Values (Get)
Manual Read:
- Click the Get button
- The current register value appears in the Value field
- The value is formatted according to the selected Format option
Automatic Read (Refresh):
- Select a refresh interval from the Refresh dropdown:
- 50 ms - Very fast updates (20 Hz)
- 100 ms - Fast updates (10 Hz)
- 500 ms - Medium updates (2 Hz)
- 1 s - Slow updates (1 Hz)
- 10 s - Very slow updates (0.1 Hz)
- The Value field automatically updates at the selected rate
- Select Manual to stop automatic refresh
Use Cases for Different Refresh Rates:
- 50-100 ms: Fast counters, rate meters, real-time status
- 500 ms - 1 s: Configuration verification, state monitoring
- 10 s: Slow-changing values (temperature, voltage monitors)
- Manual: Static configuration, single-read operations
Writing Register Values (Set)
To write a value to a register:
- Enter the desired value in the Value field
- Ensure the value is in the format matching the Format selection
- Click the Set button
- The value is written to the FPGA register
Important Considerations:
- Verify write permissions: Some registers are read-only
- Check valid ranges: Writing out-of-range values may cause unexpected behavior
- Understand bit fields: Some registers have specific bit meanings
- Read after write: Click Get to verify the write was successful
Value Format Options
The Format dropdown controls how register values are displayed and entered:
Hexadecimal (Hex)
- Base-16 representation (0x0000 to 0xFFFF for 16-bit registers)
- Useful for bit-field visualization
- Example:
0x1234,0xABCD,0xFF00 - Use when: Working with bit masks, flags, or raw memory values
Unsigned Decimal
- Base-10 positive integers (0 to 65535 for 16-bit registers)
- Natural for counts, rates, and most configuration parameters
- Example:
1000,4095,65535 - Use when: Setting numeric parameters, reading counters
Signed Decimal
- Base-10 signed integers (-32768 to +32767 for 16-bit registers)
- Interprets MSB as sign bit (two’s complement)
- Example:
-1000,+1234,-32768 - Use when: Working with offset values, temperature, signed measurements
Binary
- Base-2 representation (0b0000000000000000 to 0b1111111111111111)
- Shows individual bit states
- Example:
0b1010101010101010,0b1111000011110000 - Use when: Debugging bit fields, understanding flag combinations
Format Conversion Example: The same register value displayed in different formats:
- Hexadecimal:
0x1F40 - Unsigned Decimal:
8000 - Signed Decimal:
8000 - Binary:
0b0001111101000000
Register Tables
Tables allow simultaneous monitoring and control of multiple registers, ideal for:
- Configuration parameter management
- System initialization sequences
- Status monitoring dashboards
- Batch register operations
Creating a Table
- In Resource Explorer menu bar, select View → New Table
- An empty table window opens with default name (e.g., “Table 1”)
- To rename the table, click the
button
- Enter a descriptive name (e.g., “AFE Configuration”, “Trigger Settings”)
Naming Best Practices:
- Use functional names: “Oscilloscope Setup”, “DAC Parameters”
- Include version if testing variations: “Config v1”, “Config v2”
- Be specific: “Channel 0-3 Gains” instead of “Gains”
Adding Registers to Tables
Method 1: Individual Register Addition
- In the Registers tree, right-click a register
- Select Add to Table from the context menu
- Choose the target table from the dialog:
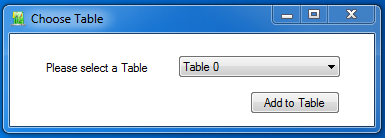
- Click Add to Table
- The register appears as a new row in the selected table
Method 2: Bulk Addition
To add all registers at once:
- Right-click the Registers node (parent of all registers)
- Select Add All to Table
- Choose the target table
- All registers are added simultaneously
When to Use Bulk Addition:
- Initial firmware validation (check all registers)
- Creating comprehensive status dashboards
- Exporting complete register snapshot
Using Register Tables
Once populated, tables provide powerful batch operations:
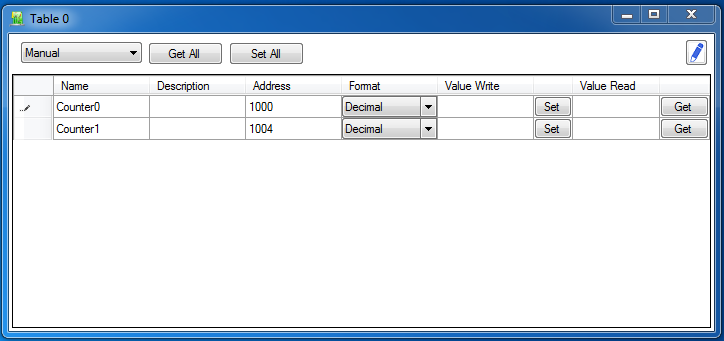
Table Columns
- Register Name: User-defined name from design
- Address: Hexadecimal address (read-only)
- Value Read: Current value read from FPGA
- Value Write: Value to write to FPGA
- Format: Display format (Hex, Unsigned, Decimal, Binary)
- Set/Get: Individual row operations
Reading Multiple Registers
Manual Read All:
- Ensure Manual is selected in the refresh dropdown
- Click Get All
- All Value Read cells update with current register values
Automatic Read All:
- Select refresh interval (50 ms, 100 ms, 500 ms, 1 s, 10 s)
- Click Start All
- All registers refresh automatically at selected rate
- Button changes to Stop All
- Click Stop All to halt automatic refresh
Performance Considerations:
- Faster rates (50-100 ms) consume more USB/Ethernet bandwidth
- Large tables (>50 registers) may experience slower updates
- Consider using multiple focused tables instead of one large table
Writing Multiple Registers
Individual Register Write:
- Enter value in the Value Write cell for the desired register
- Click the Set button for that row
- Only that register is updated
Batch Write All:
- Enter values in Value Write cells for all desired registers
- Click Set All
- All registers are written simultaneously with their Value Write values
Use Case Example - AFE Gain Configuration:
Register Name | Value Write | Action
--------------------|-------------|--------
Channel_0_Gain | 100 | Set All
Channel_1_Gain | 100 |
Channel_2_Gain | 100 |
Channel_3_Gain | 100 |
Result: All four channel gains set to 100 with one click.
Register Plots
Plots provide real-time visualization of register value changes over time, useful for:
- Monitoring counters and rate meters
- Tracking temperature or voltage drift
- Observing state machine transitions
- Debugging timing-dependent behavior
Creating a Plot
- In Resource Explorer menu bar, select View → New Plot
- An empty plot window opens with default name (e.g., “Plot 1”)
- To rename the plot, click the
button
- Enter a descriptive name (e.g., “Event Rate”, “Temperature Monitor”)
Adding Registers to Plots
- In the Registers tree, right-click a register
- Select Add to Plot from the context menu
- Choose the target plot from the dialog:
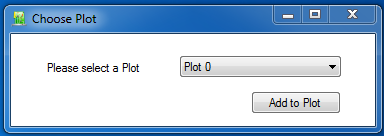
- Click Add to Plot
- The register appears in the plot’s register list
Using Register Plots
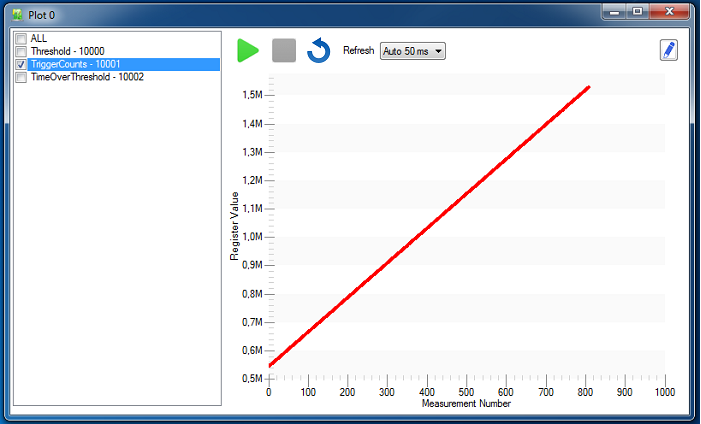
Plot Controls
Left Panel - Register Selection:
- ALL: Master checkbox to enable/disable all registers
- Individual Checkboxes: Enable specific registers for plotting
- Only checked registers appear on the plot
- Up to 16 registers can be displayed simultaneously
Top Toolbar - Acquisition Controls:
-
Start Button: Begin data acquisition
- Reads selected registers at refresh rate
- Adds new data points to plot
- Button changes to Stop icon during acquisition
-
Stop Button: Halt data acquisition
- Freezes current data display
- Registers stop updating
- Button changes back to Start icon
-
Reset Button: Clear all data
- Erases all data points from plot
- Resets X-axis to zero
- Registers remain selected
Refresh Rate Selection: Choose acquisition speed from dropdown:
- 50 ms - 20 samples/second (fast events)
- 100 ms - 10 samples/second (medium events)
- 500 ms - 2 samples/second (slow events)
- 1 s - 1 sample/second (status monitoring)
- 10 s - 0.1 samples/second (very slow trends)
Plot Display Area:
- X-axis: Time (number of samples, 0 to 1000)
- Y-axis: Register value (auto-scaling based on data range)
- Multiple colored traces, one per selected register
- Legend shows register names and colors
Data Scrolling Behavior
- Plot displays up to 1000 data points
- After 1000 samples, data shifts left automatically
- Oldest data points are discarded
- Newest data appears on the right edge
- This creates a continuous scrolling display for long acquisitions
Plot Usage Examples
Example 1: Event Rate Monitoring
Scenario: Monitor trigger rate on 4 input channels
Setup:
- Create plot named “Trigger Rates”
- Add registers:
Ch0_TriggerCount,Ch1_TriggerCount,Ch2_TriggerCount,Ch3_TriggerCount - Select all four checkboxes
- Set refresh rate to 500 ms
- Click Start
Observation:
- Four traces show trigger counts increasing over time
- Slope of each trace indicates trigger rate
- Flat line indicates no triggers on that channel
- Sudden changes indicate rate variations
Advanced Plot Features
Comparing Multiple Plots
Create separate plot windows for different register groups:
- Plot 1: “Input Rates” - All input channel counters
- Plot 2: “Output Rates” - All output channel counters
- Plot 3: “System Status” - Error flags, buffer levels
Arrange windows side-by-side to correlate behavior.
Data Export
While Resource Explorer doesn’t provide built-in export from plots, you can:
- Use File → Save to save the entire session
- Use tables instead for CSV export capability
- Take screenshots for documentation
- Use SciSDK API for programmatic data logging
Plot Troubleshooting
Problem: Plot shows no data
Possible Causes:
- Register not checked in the list
- Acquisition not started (Start button not clicked)
- Register value is constant (appears as flat line at Y value)
- Refresh rate too slow for the observed phenomenon
Solutions:
- Verify register checkbox is enabled
- Click Start button
- Increase refresh rate
- Check that register value actually changes (verify with Set/Get window)
Problem: Plot updates very slowly
Possible Causes:
- Too many registers selected
- Refresh rate too slow
- Network latency (Ethernet connection)
Solutions:
- Reduce number of selected registers
- Increase refresh rate
- Switch to USB connection if available
Problem: Traces overlap and are hard to distinguish
Possible Causes:
- Register values have very different scales
- Auto-scaling compresses some traces
Solutions:
- Create separate plots for registers with different value ranges
- Group similar registers together
- Use fewer simultaneous traces
Register Access Patterns
Read-Only Registers
These registers provide status and cannot be written:
- Version Information: Firmware build number, date
- Status Flags: Error conditions, state machine states
- Counters: Event counts, timestamps
- Measurements: ADC values, calculated results
Behavior:
- Get operations work normally
- Set operations are ignored or cause errors
- Value Write in tables has no effect
Write-Only Registers
These registers accept commands but cannot be read:
- Control Commands: Start, stop, reset, trigger
- Pulse Generators: Write triggers a single-cycle pulse
Behavior:
- Set operations work normally
- Get operations may return 0, last written value, or undefined
- Often used for momentary actions
Example - Software Trigger:
Register: SW_Trigger
Action: Write any value to trigger acquisition
Result: Writing 1 (or any value) generates trigger pulse
Reading: Always returns 0
Read-Write Registers
These registers can be both read and written:
- Configuration Parameters: Gain, threshold, delay
- Mode Selection: Operating modes, enable flags
- Calibration Values: Offsets, correction factors
Behavior:
- Set writes the value
- Get reads the current value
- Read-back verifies write was successful
Bit-Field Registers
Some registers contain multiple independent bit fields:
Example - Control Register (16 bits):
Bits [15:12]: Reserved (always 0)
Bits [11:8]: Trigger Source (0-15)
Bit [7]: Enable Flag (0=disabled, 1=enabled)
Bits [6:4]: Operating Mode (0-7)
Bits [3:0]: Channel Select (0-15)
Working with Bit Fields:
- Use Hexadecimal or Binary format for visibility
- Read current value before modifying
- Use bit masks to preserve unrelated bits
- Example: To set Enable (bit 7) without changing other bits:
- Read current:
0x0234 - Set bit 7:
0x0234 | 0x0080 = 0x02B4 - Write result:
0x02B4
- Read current: